The PROJECT MENCHIE website aims to empower residents, businesses and government stakeholders of Mandaluyong City with 360° situational awareness of weather, environmental conditions and natural disasters. The Website was designed to have a 24×7 risk analysis of Barangays, Schools, Health Centers, Business Centers and other locations within Mandaluyong City. Below are the main components of PROJECT MENCHIE website.
To make it simple, a color warning is applied to various parameters. ![]()
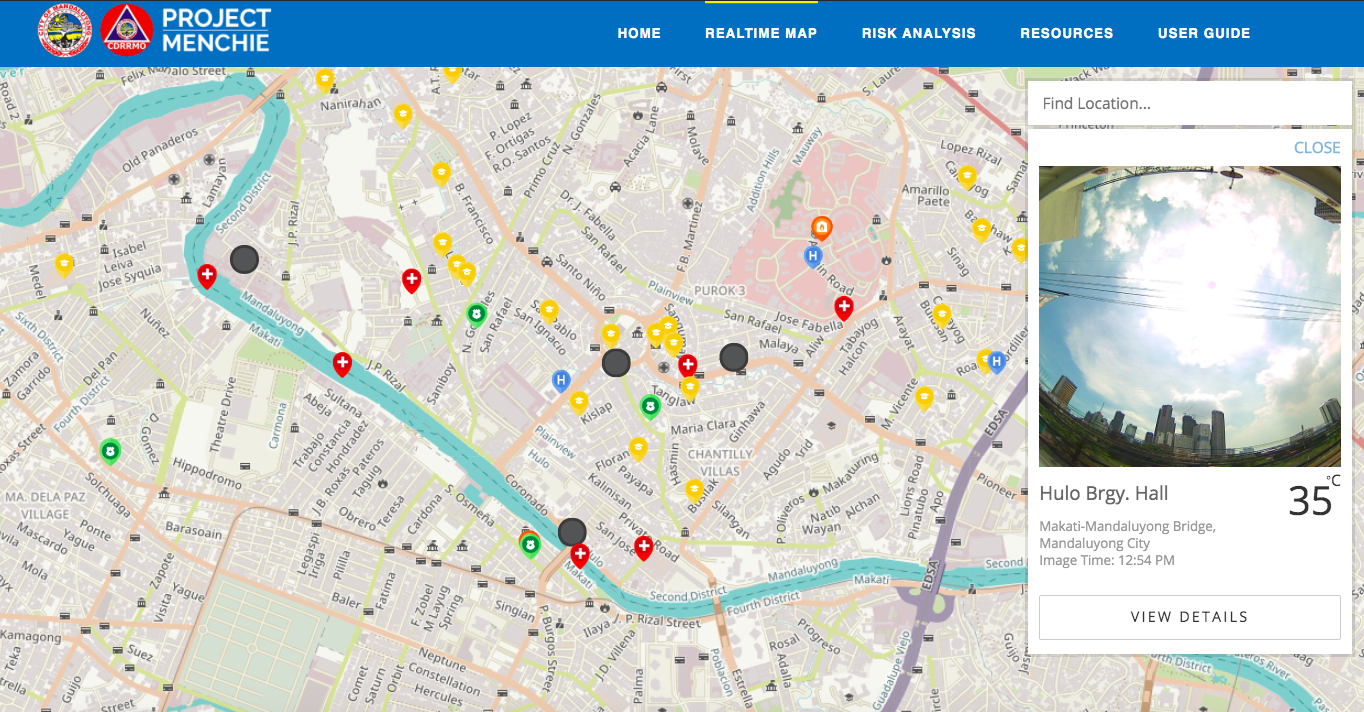
The realtime map displays the smart weather cameras that take weather measurements 24×7 and a camera that takes pictures every 5-min during the daytime. It also includes a directory of important locations for disaster preparedness and response.
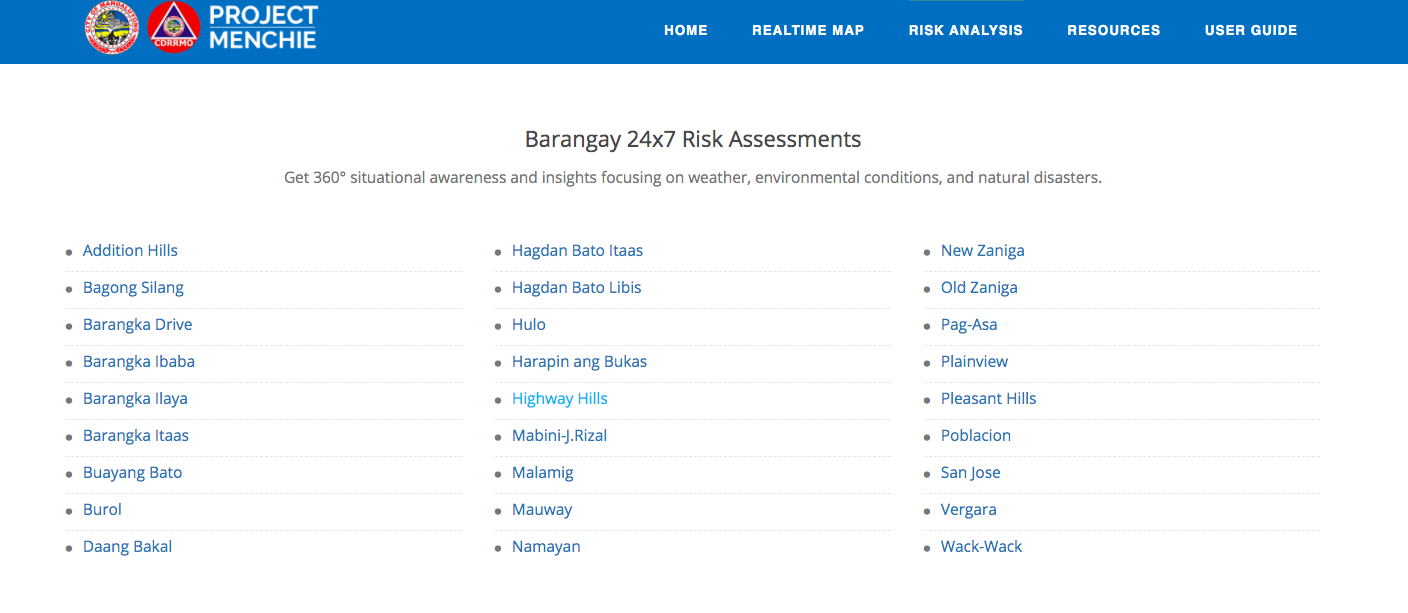
The risk analysis section is available 24×7 to each of Mandaluyong City Barangays. This contains analysis related to weather, tropical cyclones, air quality, mosquito activity and other weather- lifestyle related risks. The smart weather camera also helps in the visibility of each location. You may click and save the link of your Barangay to view the risk analysis.
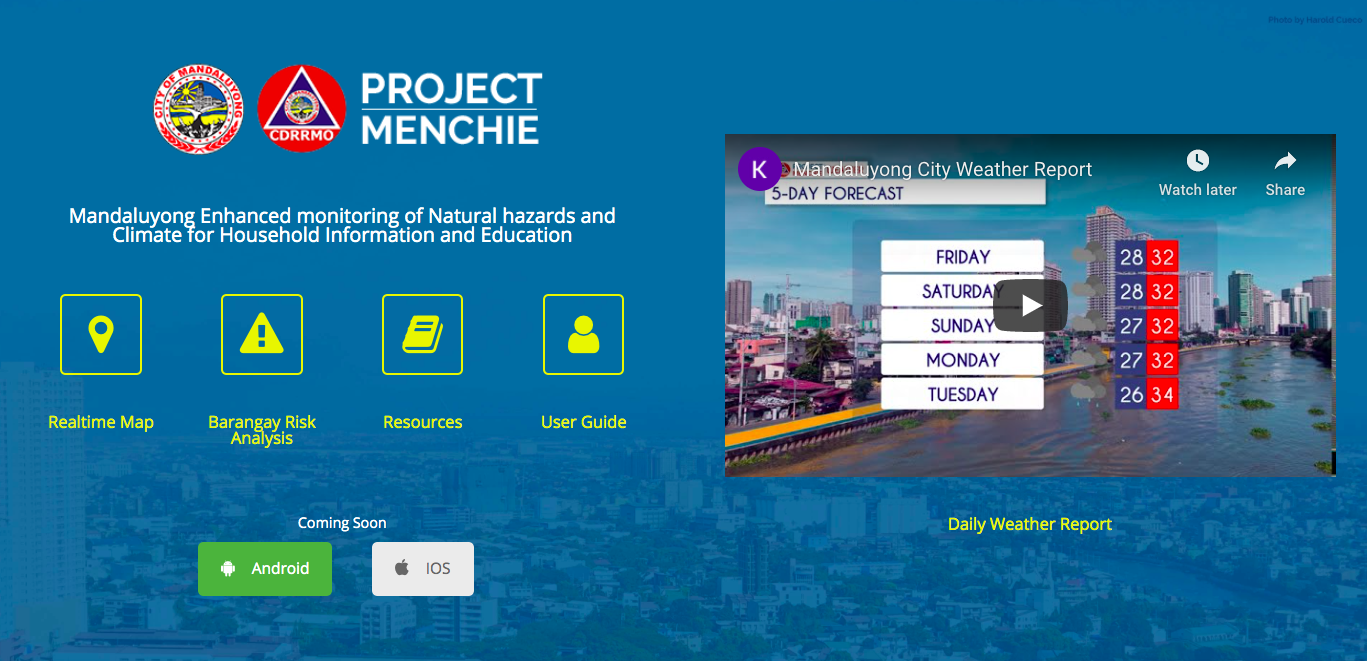
Daily Weather Videos are available in the system. This contains animated weather reports specific to rain, wind, temperature, flood, typhoon and earthquake. In some cases, The Mandaluyong CDRRMO team will have weather broadcasters report the situation.
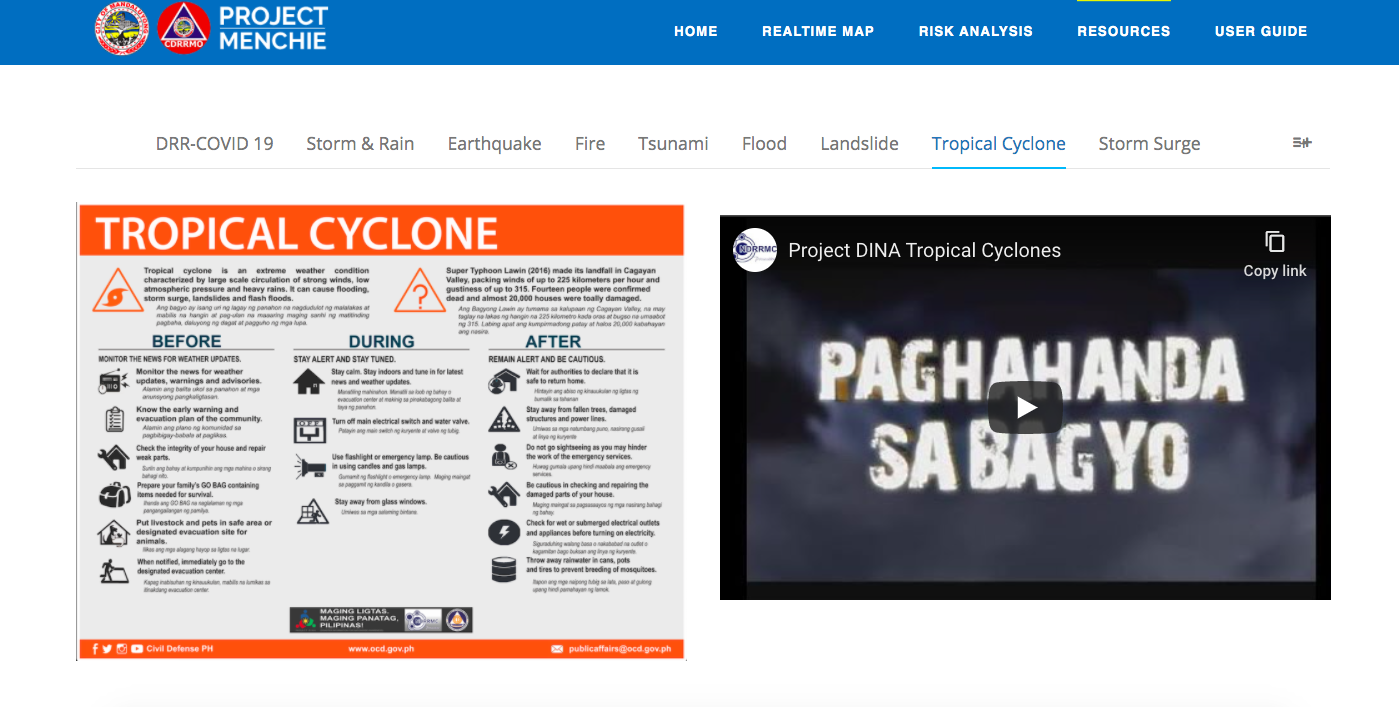
The resources section contains consolidated materials & documents related natural to disaster preparedness and response. You may browse from various materials consolidated by Mandaluyong CDRRMO.
The PROJECT MENCHIE Mobile Application aims to empower residents, businesses and government stakeholders of Mandaluyong City with 360° situational awareness of weather, environmental conditions and natural disasters. The Mobile Application was designed for users to input places that matter to them to see risk analysis 24×7. Below are the main components of PROJECT MENCHIE Mobile Application. The Mobile Application is FREE for download.
To make it simple, a color warning is applied to various parameters. ![]()
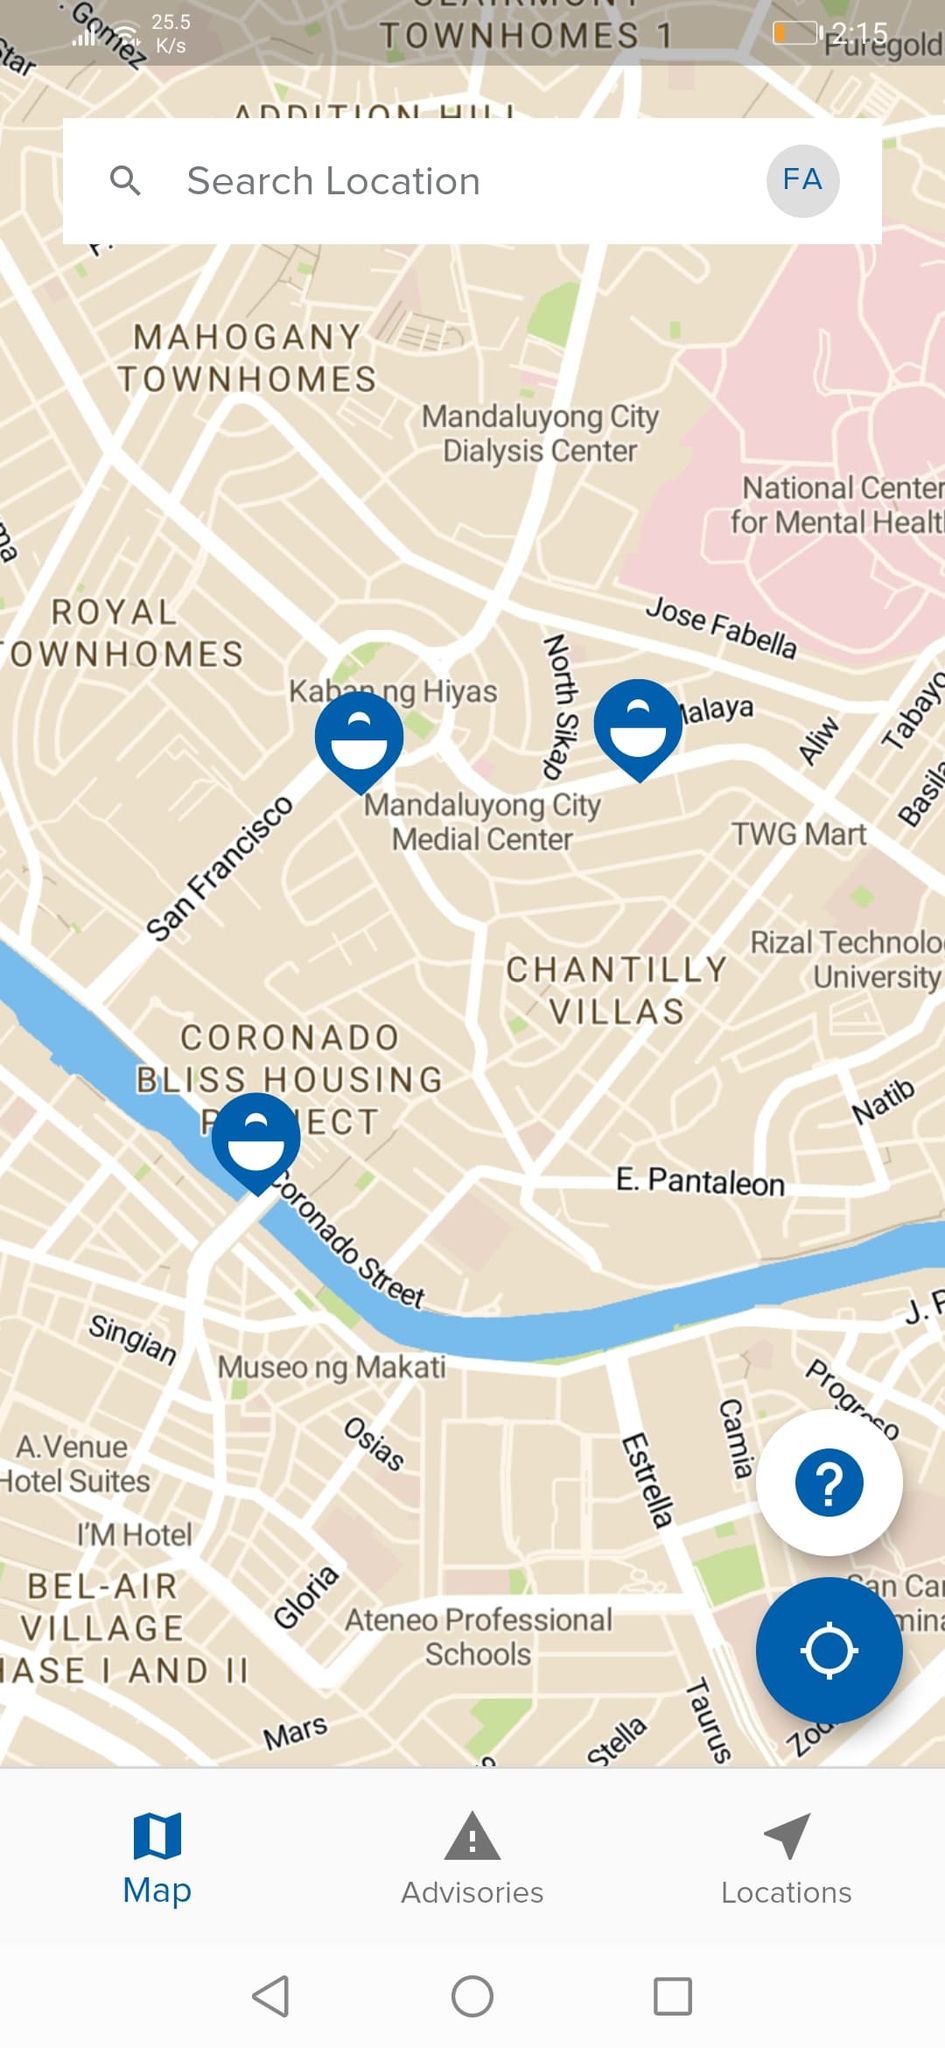
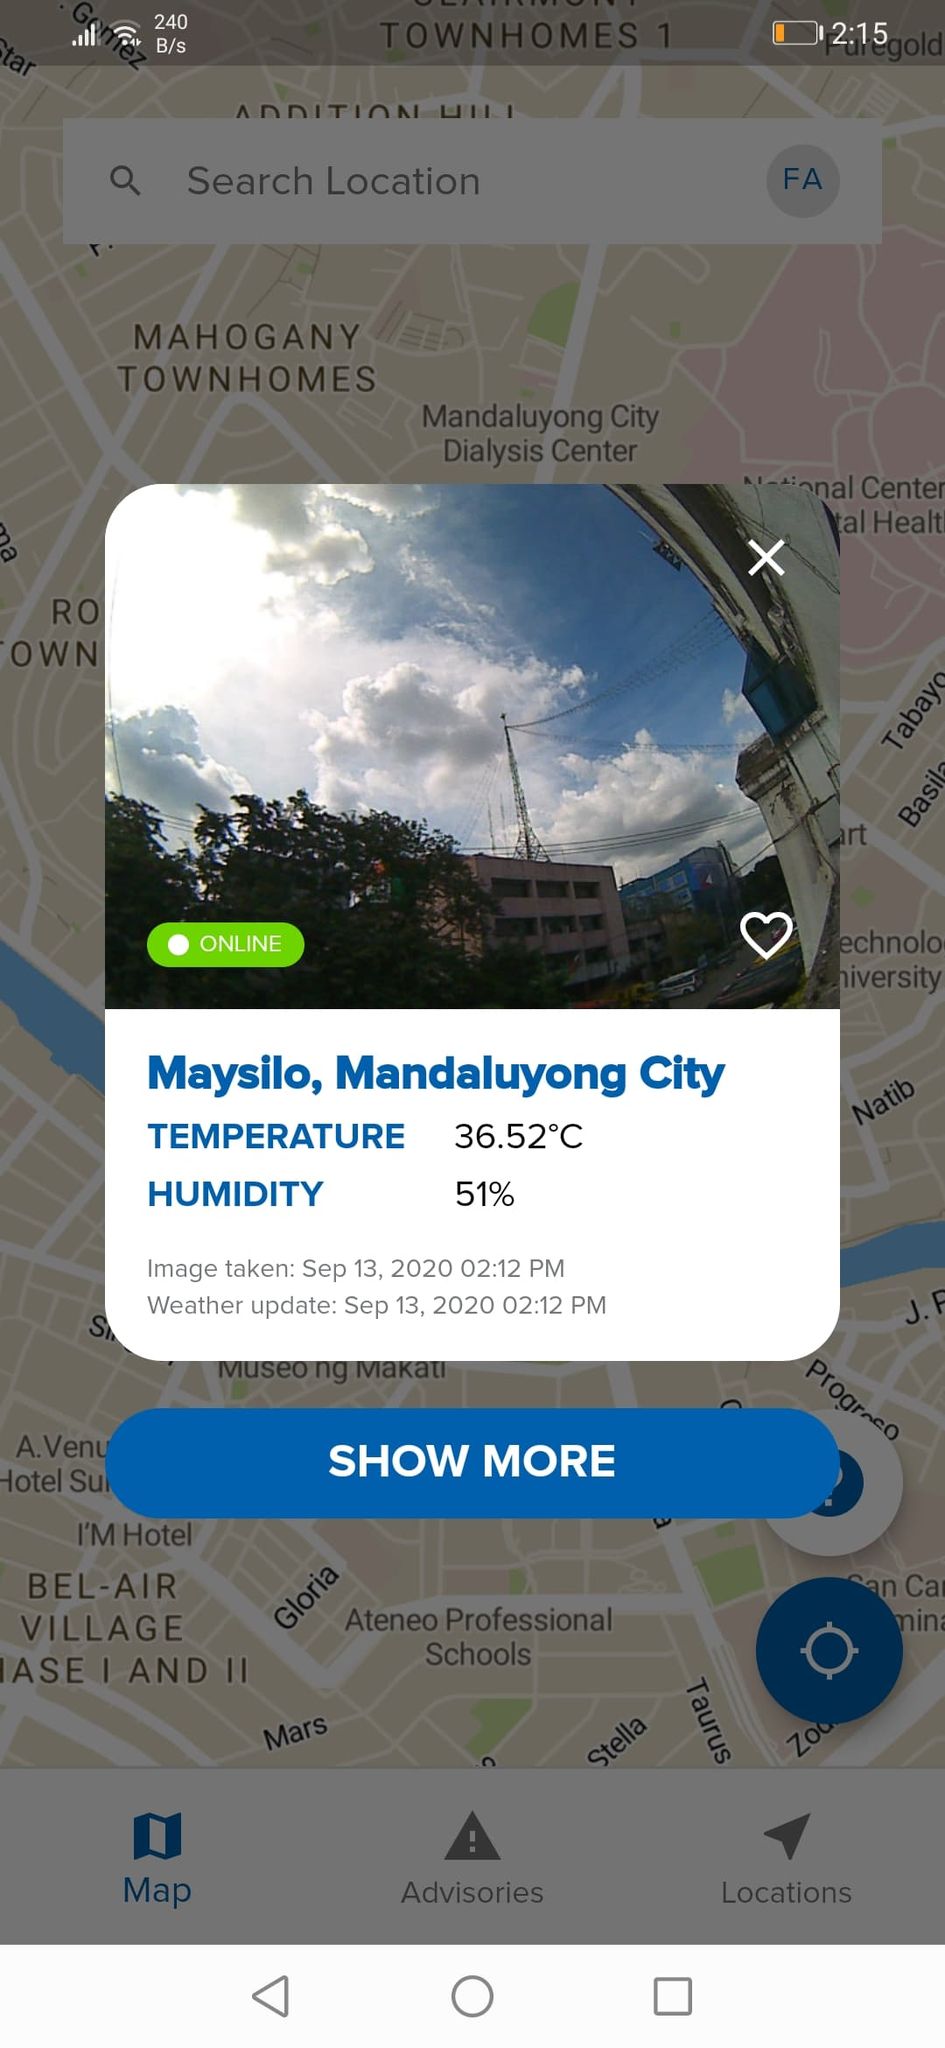

Browse thru the Mandaluyong CDRRMO Smart Weather Network and ADD locations that matter to you.
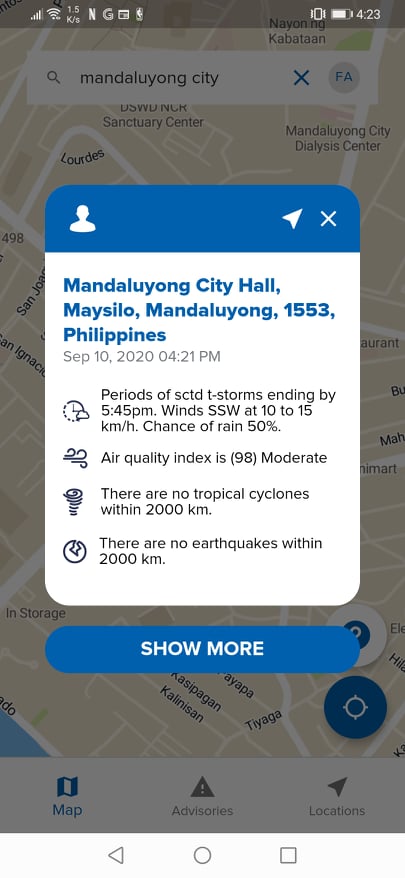
See the risk summary of a specific location.
You may “Favorite” a location in the map or manually add/edit/delete locations that matter to you.
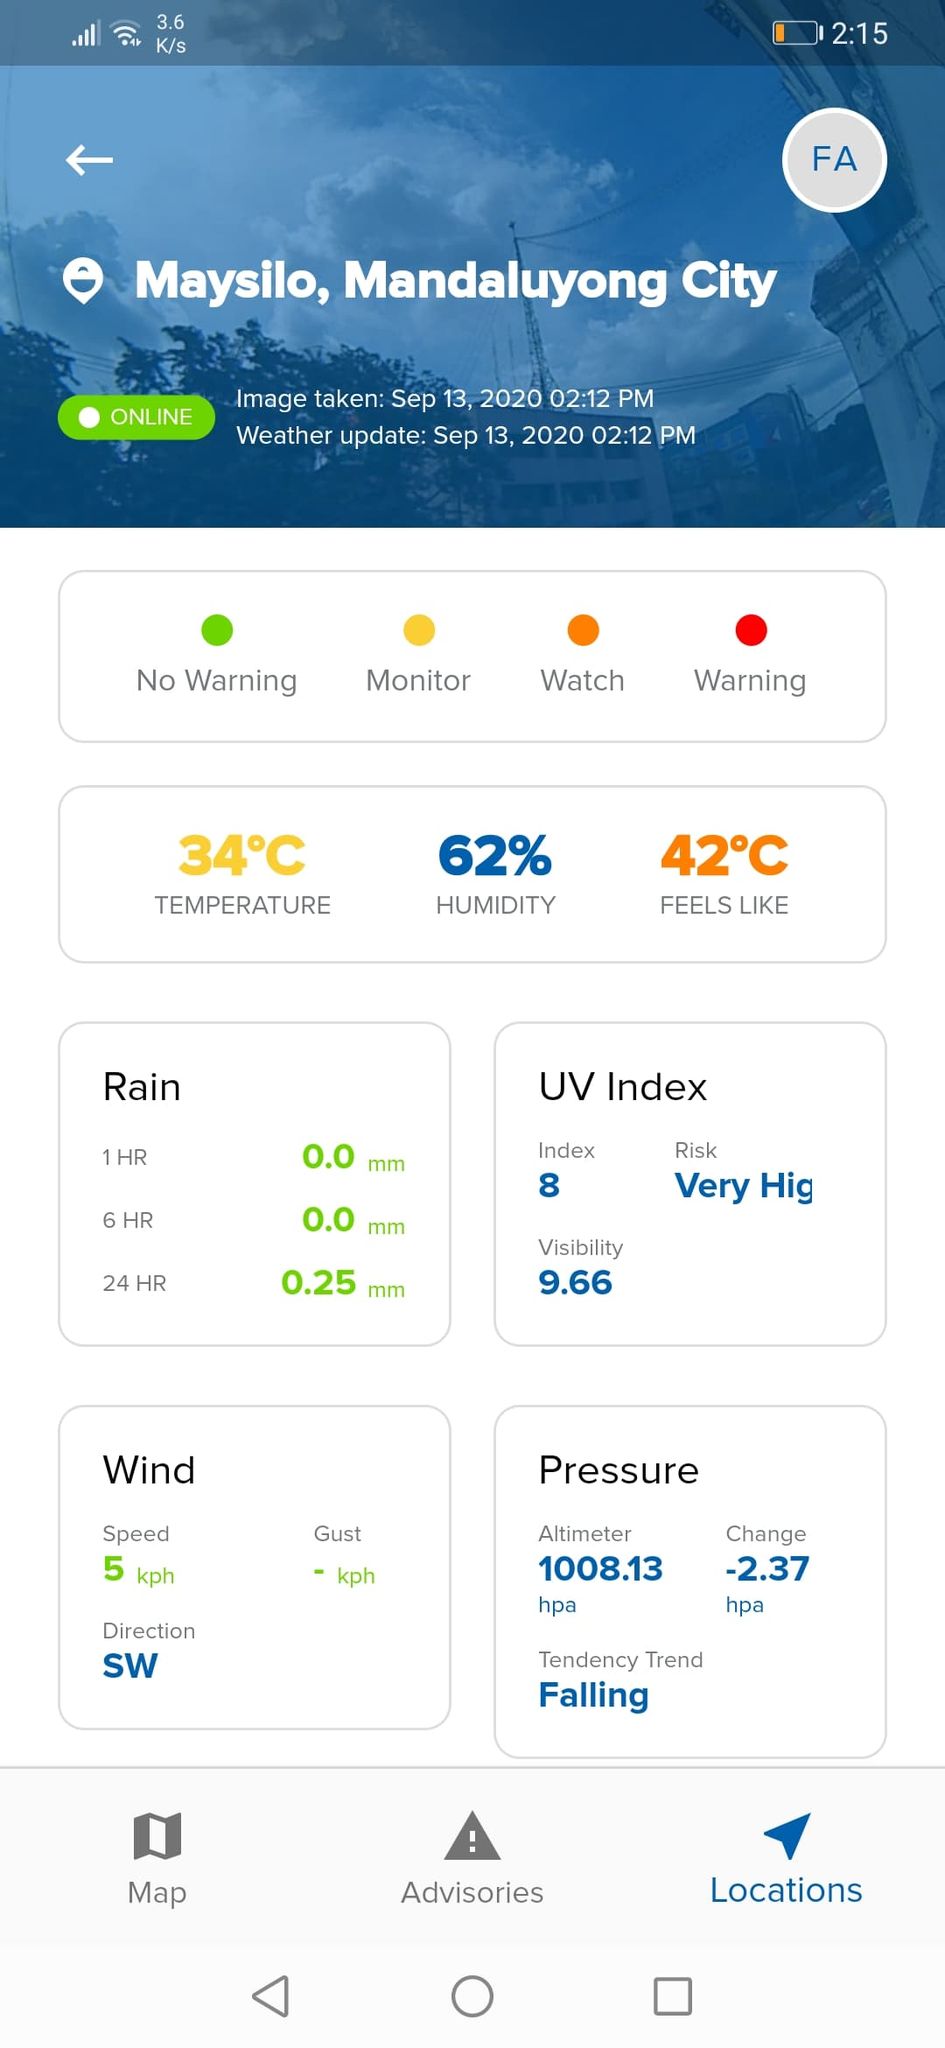
Displays estimated weather with color warnings.
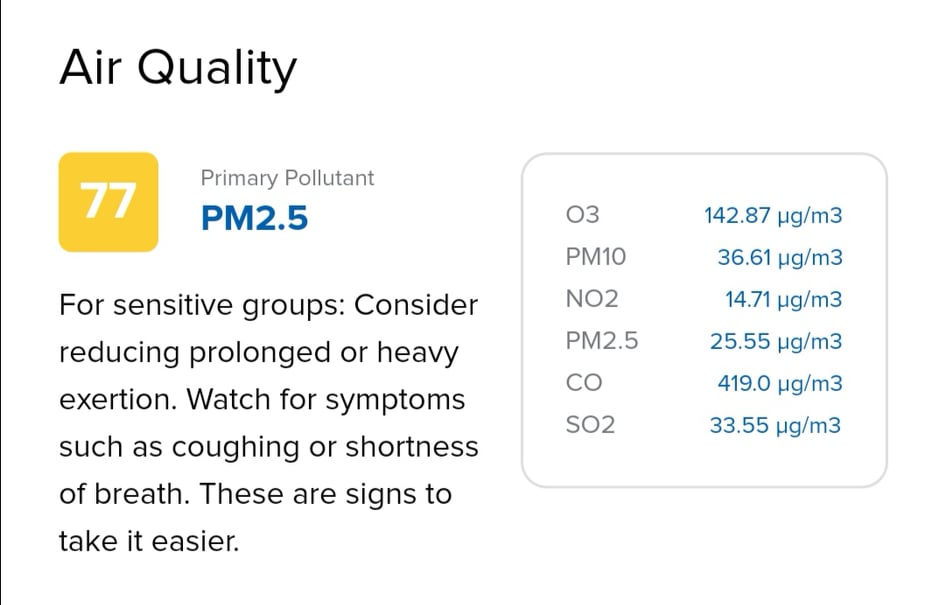
Displays Air Quality with color warnings.
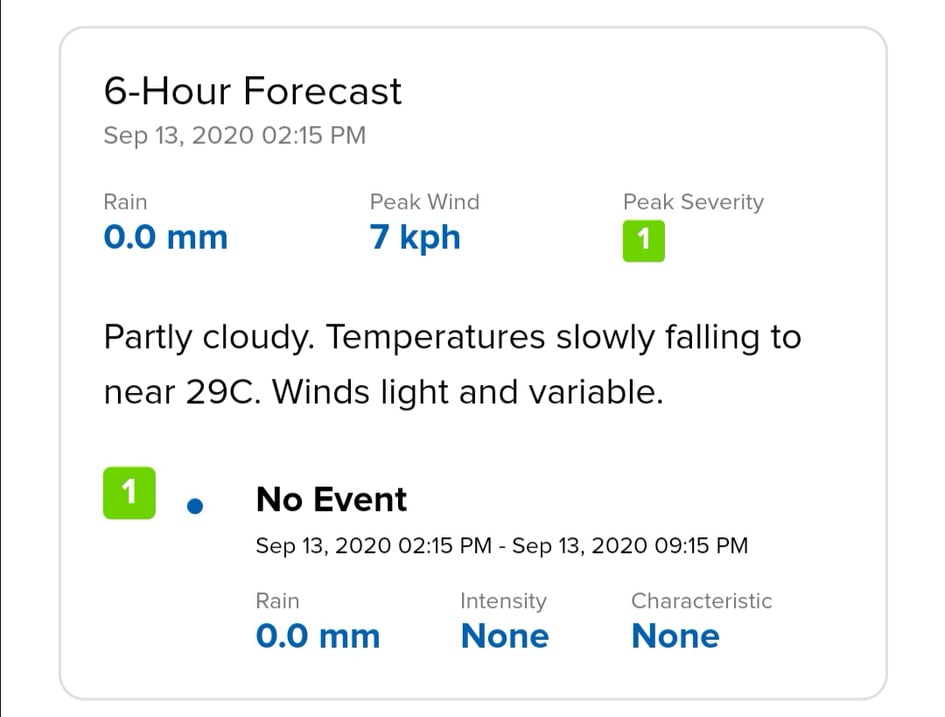
Displays the weather in the next 6 hours with severity levels and color warnings.
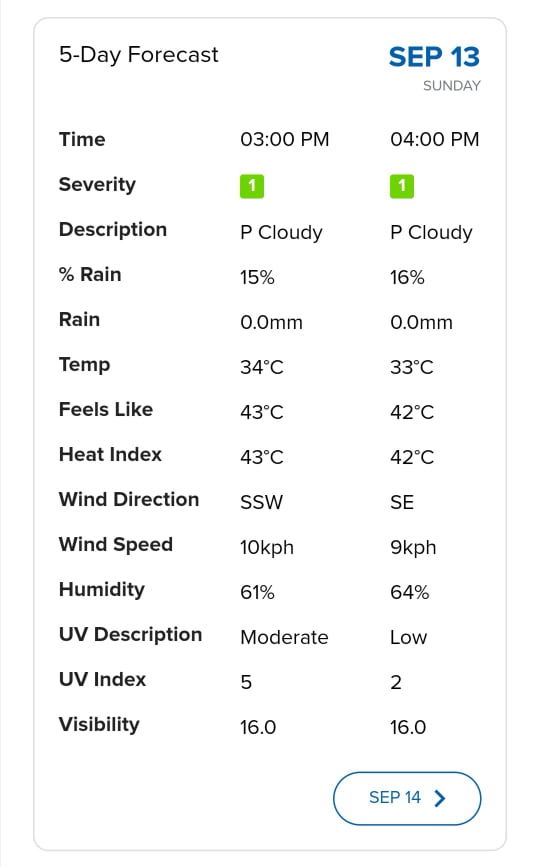
Displays hourly 5 day weather forecast with severity levels and color warnings.
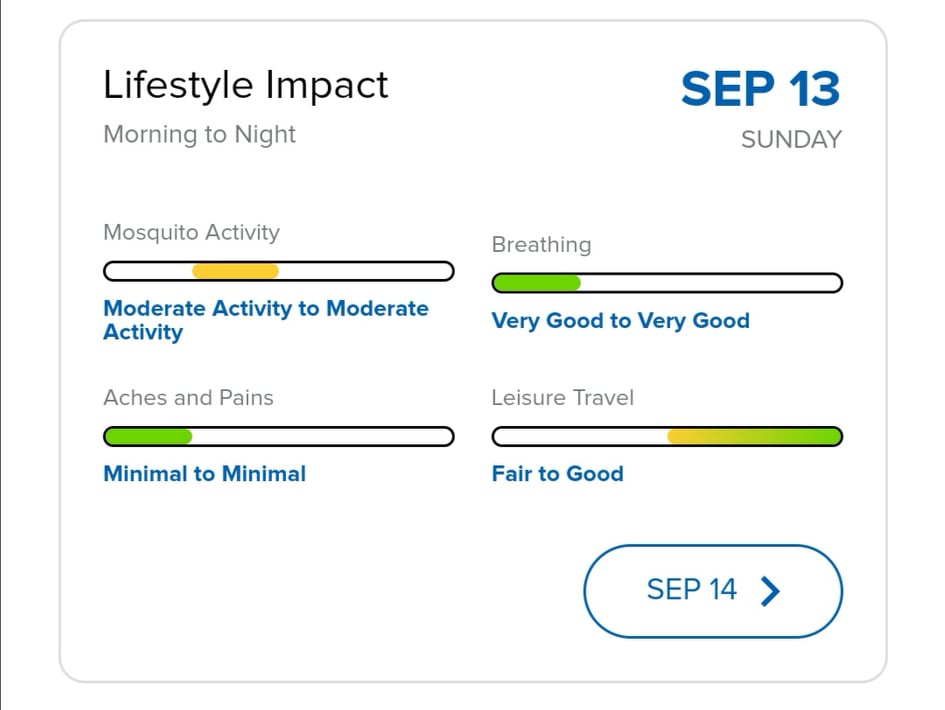
Displays the impact of weather to various lifestyles with color warnings.
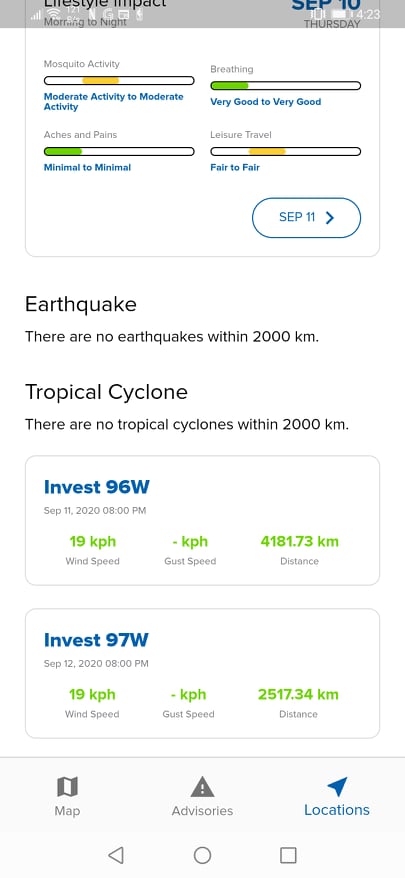
Displays recent earthquakes in the Philippines with color warnings.

Displays tropical cyclone information with color warnings.
See the latest advisories from PAGASA such as Tropical Cyclone Alert and Warning, and General Flood Alerts
This feature is now available and you can see important advisories directly from Mandaluyong City CDRRMO.
This feature is now available and you can see social media feeds from Mandaluyong City CDRRMO, Mandaluyong City PIO, PAGASA and PHIVOLCS.
The Risk Analysis section of the whole system contains multiple parameters and each section can be used in various cases.
To make it simple, a color warning is applied to various parameters. ![]()
The smart weather cameras take weather measurements 24×7 and a camera that takes pictures every 5-min during the daytime and a 5-day historical daytime timelapse of the location.
The warning threshold per parameter is based on standard best practices in the Philippines.
This section contains synthetic weather observations to estimate the local weather in a specific area. It is at request time, assimilates a variety of meteorological inputs to derive a current condition value precise to the requested location on the Earth’s surface. The meteorological inputs include physical surface observations, radar, satellite, lightning and short-term forecast models.
The warning threshold per parameter is based on standard best practices in the Philippines.
This section includes an overall Air Quality Index, Air Quality Category Index and Category. This also includes the principal pollutant type, measurement, index number and level, and any applicable health recommendation text.
- O3 – Ozone
- CO – Carbon Monoxide
- NO2 – Nitrogen Dioxide
- SO2 – Sulfur Dioxide
- PM2.5 – Particulate matter less than 2.5 microns
- PM10 – Particulate matter less than 10 microns
The Global Air Quality geographical coverage includes all land based areas in the world.
The warning threshold is based on the standard Air Quality index.
This section provides access to information on the active tropical cyclones (International Data), such as invests/LPA, tropical depressions, tropical storms, hurricanes, and typhoons, across the globe. Includes information on an individual storms name, position, historical track and forecasts. This is based on data from the Joint Typhoon Warning Center (JTWC).
The warning threshold is based on the distance of the center of the tropical cyclone or Invest/LPA to a specific location.
This section provides information on recent earthquakes in the Philippines, including location, magnitude, depth, and more. This information is coming from United States Geological Survey (USGS).
The warning threshold is based on the distance of the earthquake to a specific location.
The section contains the latest satellite image including tropical cyclones (International Data), global radar (Derived Data) and lightning strikes.
This section provides a summary of the weather forecast for the next 6 hour period for today. Below shows how impactful is the forecasted weather for this forecast period.
The warning threshold is based on the severity level of 0 = no threat, 6 = dangerous / life threatening.
This section provides a weather forecast over the next 6 hours based upon data from the Rain Assessment forecast. The Rain Assessment Forecast provides a weather forecast for precipitation events onset and offset times for 28 time steps over the next 7 hours.
This section provides a weather forecast for precipitation events onset and offset times for 28 time steps over the next 7 hours.
The Rain Assessment Forecast (aka “onset/offset”, aka “precip events”) is the summary “events” of the raw 15-minute data. In practice 24 time steps are almost never returned. There is often only 1 event (e.g., “dry through the entire 6hr period”). However, there will always be at least one event returned. While the theoretical maximum is 24 events, in practice it rarely goes above 10-12 events.
During a 6 hour period if the weather changes from dry to cloudy to rain then you have a record for each part with start time and end time. Unlike like hourly or other time sliced forecast that are based on time period. This forecast is based on weather events and not on time.
The warning threshold is based on the severity level of 0 = no threat, 6 = dangerous / life threatening.
This section contains a 15days hourly forecast that contains various parameters such as Severity, Weather Description, % Rain (Chance of Rain), Rain, Temperature, Feels Like, Heat Index, Wind Direction, Wind Gust, Wind Speed, Humidity, UV Description, UV Index, Visibility and Weather Condition.
The warning threshold per parameter is based on standard best practices in the Philippines.
The section contains the latest satellite image including tropical cyclones (International Data), global radar (Derived Data) and lightning strikes.
This section provides access to information on the active tropical cyclones (International Data), such as invests/LPA, tropical depressions, tropical storms, hurricanes, and typhoons, across the globe. Includes information on an individual storms name, position, historical track and forecasts. This is based on data from the Joint Typhoon Warning Center (JTWC).
The warning threshold is based on the distance of the center of the tropical cyclone or Invest/LPA to a specific location.
The Mosquito index indicates the weather’s influence on the activity of mosquitoes based on weather conditions. In the context of this section, seasonality is controlled by making use of both a critical day length factor found to relate to mosquito activity as well as a climatological average minimum temperature threshold.
The weather factors involved include relative humidity, temperature and wind speed. Low wind speeds, high relative humidity and warm, but-not-hot temperatures form weighted contributions.
The index is calculated hour-by-hour, then “rolled up” to create both an “evening mosquito index” (1 per day) and a 2-per-day “daypart” mosquito index (for “daytime” and “nighttime”).
The warning threshold is based on the index and category.
The Breathing index indicates weather’s influence on the ability to breath for respiratory-sensitive individuals including those who suffer from asthma.
The warning threshold is based on the index and category.
The Aches and Pains index indicates the weather’s influence on an individual’s potential to feel aches and pains.
The warning threshold is based on the index and category.
The UV Index provides indices of the intensity of the solar radiation level and risk of skin damage due to exposure.
The warning threshold is based on the index and category.
The Leisure Travel index provides indices of outdoor travel / sightseeing conditions due to weather.
The warning threshold is based on the index and category.
Available in the Realtime Map
- Realtime Map – Mandaluyong City DRRMO Smart Weather Network (IOT Cameras)
Available in the Risk Analysis
- Weather Observations – Mandaluyong City DRRMO Smart Weather Network (IOT Cameras)
- Enhanced Weather Observations – Komunidad, IBM and The Weather Company
- Enhanced Weather Forecast – Komunidad, IBM and The Weather Company
- 6HR Weather – Komunidad, IBM and The Weather Company
- Lifestyle Impact – Komunidad, IBM and The Weather Company
- Air Quality – Copernicus Atmosphere Monitoring Service (CAMS Europe)
- Tropical Cyclone – Joint Typhoon Warning Center (JTWC)
- Earthquakes – United States Geological Survey (USGS)
Available in the Weather Report
- Data from PAGASA (Philippines) and New Zealand Government (MetService)
Additional data available only in the Mobile Application
- Advisories: General Flood Advisory – PAGASA (Philippines)
- Advisories: Tropical Cyclone Alert – PAGASA (Philippines)
- Advisories: Tropical Cyclone Warning – PAGASA (Philippines)
